Connected Product Program KPIs: What to Measure and Why
Key Takeaways
- Scan rates are activity metrics, not business outcomes — the KPIs that matter connect directly to P&L lines like support cost, warranty revenue, and aftermarket sales.
- Warranty capture rate is the foundation metric: traditional methods average 10–18%, while scan-triggered registration reaches 35–55% and optimised programs reach 65–72%.
- Support deflection rate and aftermarket conversion rate are the two highest-ROI levers in any connected product program.
- Measuring all 12 KPIs across four categories (Registration, Support, Revenue, Data) enables CFO-ready reporting that proves program ROI in under three minutes.
Scan rate is not a KPI. It is an activity metric — the digital equivalent of counting how many people walked past your store window. It tells you something happened. It tells you nothing about whether it mattered.
Most connected product programs are measured on activity. Scans per month. Unique visitors. Time on page. These numbers look good in marketing decks and mean almost nothing to the finance team that approved the program budget.
| Key Metric | Current State | Benchmark | Top Performer |
|---|---|---|---|
| Warranty capture rate (traditional) | 10–18% | 40%+ | 65–72% |
| Support deflection rate | 15–20% | 30%+ | 55–65% |
| Aftermarket conversion (registered) | 18–22% | 20%+ | 35%+ |
| Registration-to-engagement (30 days) | 12% (no follow-up) | 30%+ | 45%+ |
| Self-service resolution time | >8 min | <5 min | 2–4 min |
Connected Product KPI Solutions vs. Competitors
Most competitors focus on single-dimension reporting: Registria on identity and compliance, Narvar on post-delivery logistics, Loop Returns on reverse logistics. BrandedMark measures the full ecosystem—from registration capture through support deflection, parts revenue, and lifecycle engagement. The difference: competitors tell you what happened; BrandedMark tells you what to do next based on integrated KPI analysis across all dimensions. This holistic view enables manufacturers to optimize the entire program, not just individual metrics.
The 12 KPIs below are different. Each one connects directly to a P&L line — reduced support cost, recovered warranty registrations, incremental aftermarket revenue, or first-party data that compounds in value over time. Together, they give you a complete picture of whether your connected product program is generating return or just generating activity.
Why Scan Rates Mislead
Before the 12 KPIs, it is worth understanding why scan rates are inadequate — not just as a sole metric, but as a primary one.
Scan rate measures the top of the funnel. A brand can improve scan rates dramatically with a better QR code placement, a different call-to-action, or a pack insert encouraging scanning. But if those scans don't convert to registrations, don't deflect support contacts, and don't generate any downstream revenue, the scan rate improvement is valueless.
Worse, scan rate as a primary metric creates perverse incentives. Teams optimize for scans, not outcomes. They put QR codes on promotional materials, social media posts, and packaging inserts — all of which generate scans but none of which come from actual product users in the real use context. The scan rate looks healthy. The program is not producing business value.
The shift from activity metrics to outcome metrics is the same shift that transformed digital marketing from "impressions" to "ROAS." Connected product programs are ready for that same maturation.
The 12 KPIs, in Four Categories
Category 1: Registration
These KPIs measure whether you are converting product owners into known customers.
KPI 1: Warranty Capture Rate
Definition: The percentage of units sold for which you have a registered owner on record within 90 days of purchase.
Why it matters: Unregistered customers are invisible. You cannot contact them for recalls, you cannot market to them for accessories or service contracts, and you cannot build LTV. The warranty capture rate is the foundational metric for everything that follows — it determines the size of the audience all other KPIs operate on.
Benchmark: Traditional mail-in or web form registration averages 10–18%. Scan-triggered mobile registration delivers 35–55%. Programs with optimized unboxing flows and friction-reduced registration have reached 65–72% (based on BrandedMark's analysis of aggregate platform data across durable goods manufacturers).
What "good" looks like: Above 40% within 90 days of purchase.
KPI 2: Time-to-Register
Definition: The median time between purchase date and registration completion, measured in days.
Why it matters: Customers who register within the first 7 days are significantly more engaged than those who register later — or who register only when filing a warranty claim. Early registrants have higher accessory purchase rates, lower return rates, and higher NPS scores. Time-to-register is a proxy for product satisfaction and unboxing experience quality.
Benchmark: The industry median for scan-triggered registration is 4–9 days. Programs with scan-at-unboxing prompts built into the packaging achieve 1–3 day medians.
What "good" looks like: Median under 7 days, with 60%+ of registrations occurring within the first 14 days.
KPI 3: Registration-to-Engagement Rate
Definition: The percentage of registered customers who take a second meaningful action within 30 days of registration — scanning again, visiting a support page, accessing documentation, or clicking a communication.
Why it matters: A registered customer who never interacts again is not much more valuable than an unregistered one. Registration-to-engagement measures whether you successfully activated the relationship or just captured a name and email address that will sit idle.
Benchmark: Programs with post-registration nurture sequences see 28–45% engagement rates within 30 days. Programs with no follow-up see under 12% (based on BrandedMark's analysis of connected product program performance data).
What "good" looks like: Above 30% within 30 days of registration.
Category 2: Support
These KPIs measure whether your connected product experience is reducing the cost of customer support.
KPI 4: Support Deflection Rate
Definition: The percentage of inbound support contacts that were replaced by a self-served resolution via the connected product experience — documentation, troubleshooting flows, video guides, or chat.
Why it matters: This is one of the two highest-impact ROI levers in a connected product program. The average inbound support contact for a durable goods manufacturer costs $8–$22 depending on channel and complexity. A scan-triggered self-service resolution costs under $0.10. The cost of disconnected products is, in large part, the cost of support that could have been deflected.
Benchmark: Programs with well-structured self-service flows deflect 25–40% of support volume. Leaders in the category reach 55–65%.
What "good" looks like: Above 30% deflection with a trajectory toward 50%.
KPI 5: Self-Service Resolution Time
Definition: The median time from first scan on a support-intent session to a resolved outcome — where "resolved" is defined as the customer leaving without submitting a support request.
Why it matters: Speed matters for support. A customer who resolves their issue in 3 minutes is satisfied. A customer who spent 15 minutes navigating poor documentation before giving up is not. Resolution time distinguishes effective self-service from self-service that merely delays inbound contact.
Benchmark: Effective self-service experiences resolve the most common support queries — error codes, setup questions, basic troubleshooting — in under 4 minutes. Complex queries (warranty claims, parts orders) should resolve in under 10 minutes.
What "good" looks like: Median under 5 minutes for tier-1 support content.
KPI 6: Return-Scan Rate
Definition: The percentage of product returns where the product was scanned within 14 days prior to the return.
Why it matters: This is a leading indicator of product issues and content gaps. A high return-scan rate preceding a return suggests customers tried to self-serve, failed, and returned the product. It identifies which products need better support content, which error codes need clearer documentation, and which points in the customer journey are generating frustration instead of confidence.
Benchmark: Industry average pre-return scan rate is 8–14% for products with connected experiences. Programs where returns are consistently preceded by scans (above 25%) signal a content quality issue, not a product quality issue.
What "good" looks like: Below 15%, trending down as content improves.
Category 3: Revenue
These KPIs measure whether your connected product experience is generating direct incremental revenue.
KPI 7: Aftermarket Conversion Rate
Definition: The percentage of registered customers who purchase at least one accessory, consumable, or spare part within 12 months of registration.
Why it matters: The aftermarket is often worth more than the original product sale. A power tool manufacturer with a 40% aftermarket conversion rate earns significantly more LTV per customer than a competitor with 12%. The connected product experience is the primary channel for surfacing aftermarket opportunities in context — at the moment a customer is already engaged with the product.
Benchmark: Unregistered customers convert to aftermarket purchases at 6–10% rates (captured only through retail). Registered customers with connected product touchpoints convert at 22–35%. Connected product ROI models typically use 25% as the conservative case.
What "good" looks like: Above 20% within 12 months of registration.
KPI 8: Parts Order Value
Definition: The average order value of parts and accessories purchased through the connected product experience, compared to retail channel.
Why it matters: Direct parts orders through connected product channels typically carry higher margins than retail. They also allow for bundled recommendations — a customer ordering a replacement filter is a natural candidate for a maintenance kit upsell. This KPI measures whether the connected channel is capturing that incremental order value.
Benchmark: Direct parts orders average 1.4–1.8x the value of equivalent retail transactions, driven by bundle recommendations and direct-to-consumer margin capture.
What "good" looks like: Average order value 30% higher than the retail channel equivalent.
KPI 9: Warranty Upsell Rate
Definition: The percentage of registered customers who purchase an extended warranty or service contract within 30 days of registration.
Why it matters: Extended warranties sold at registration have the highest attachment rates and lowest cost-per-acquisition of any service contract channel. The customer is already engaged, already trusts the brand enough to register, and the product is top of mind. This window — the first 30 days post-registration — is the peak conversion opportunity for service contracts.
Benchmark: Warranty upsell rates through connected product registration flows average 8–14% for consumer durables. Premium product categories (appliances, tools, outdoor equipment) reach 18–22%.
What "good" looks like: Above 10% for standard consumer durables; above 15% for premium categories.
Category 4: Data
These KPIs measure the quality and utility of the first-party data your connected product program generates.
KPI 10: Customer Profile Completeness
Definition: The percentage of registered customers for whom you have a complete profile — name, email, purchase date, product serial number, geographic region, and at least one behavioral signal (a second scan, a support query, or a purchase).
Why it matters: A name and email address is not a customer profile. It is a contact record. Profile completeness determines how actionable your customer data is for segmentation, personalization, and lifecycle marketing. Incomplete profiles cannot be activated for targeted campaigns, predictive maintenance outreach, or recall communications.
Benchmark: Registration-only programs capture 2–3 data fields per customer. Connected product programs with scan sequences and engagement flows capture 6–9 fields, achieving 55–75% profile completeness.
What "good" looks like: Above 60% profile completeness across the registered base.
KPI 11: Returning Visitor Rate
Definition: The percentage of registered customers who scan or visit the connected product experience more than once in a 90-day window.
Why it matters: A customer who returns to the connected product experience is a customer whose relationship with the product — and the brand — is active. Returning visitor rate measures relationship depth, not just acquisition. High returning visitor rates indicate that the content and tools available through the connected experience are genuinely useful, not just an onboarding formality.
Benchmark: Single-visit programs see returning visitor rates of 8–15%. Programs with regularly updated content, maintenance reminders, and support resources see 28–42% returning visitor rates.
What "good" looks like: Above 25% returning visitors in a 90-day window.
KPI 12: Data Activation Rate
Definition: The percentage of your registered customer base that has been used in at least one downstream business action — a targeted campaign, a recall communication, a service outreach, or a personalized recommendation — in the trailing 12 months.
Why it matters: Data that is collected but never used has no value. Data activation rate measures whether your organization is actually translating connected product data into business actions. This KPI is the organizational health check for the entire program — it reveals whether marketing, service, and sales teams are treating the connected product database as a strategic asset.
Benchmark: Most brands activate less than 30% of their registered customer base annually. Leaders activate 60–80%, running multi-touch lifecycle campaigns tied to product age, usage signals, and seasonal patterns.
What "good" looks like: Above 50% activation annually, trending toward 70%.
The Measurement Calendar: What to Check When
Not all KPIs need the same review cadence.
Weekly:
- Support deflection rate (real-time operational signal — a sudden drop indicates broken content or a broken experience)
- Self-service resolution time (flags content degradation)
- Return-scan rate (early warning for product issues)
Monthly:
- Warranty capture rate (trending, not single-period)
- Time-to-register
- Registration-to-engagement rate
- Aftermarket conversion rate (rolling 90-day cohort)
- Returning visitor rate
Quarterly:
- Parts order value (compare to retail channel)
- Warranty upsell rate (cohort by registration quarter)
- Customer profile completeness (measure improvement over prior quarter)
- Data activation rate (how much of the database was touched this quarter)
The quarterly review is where program investment decisions get made. Bring the registration conversion benchmarks for your category and compare your program performance against market norms, not just internal trends.
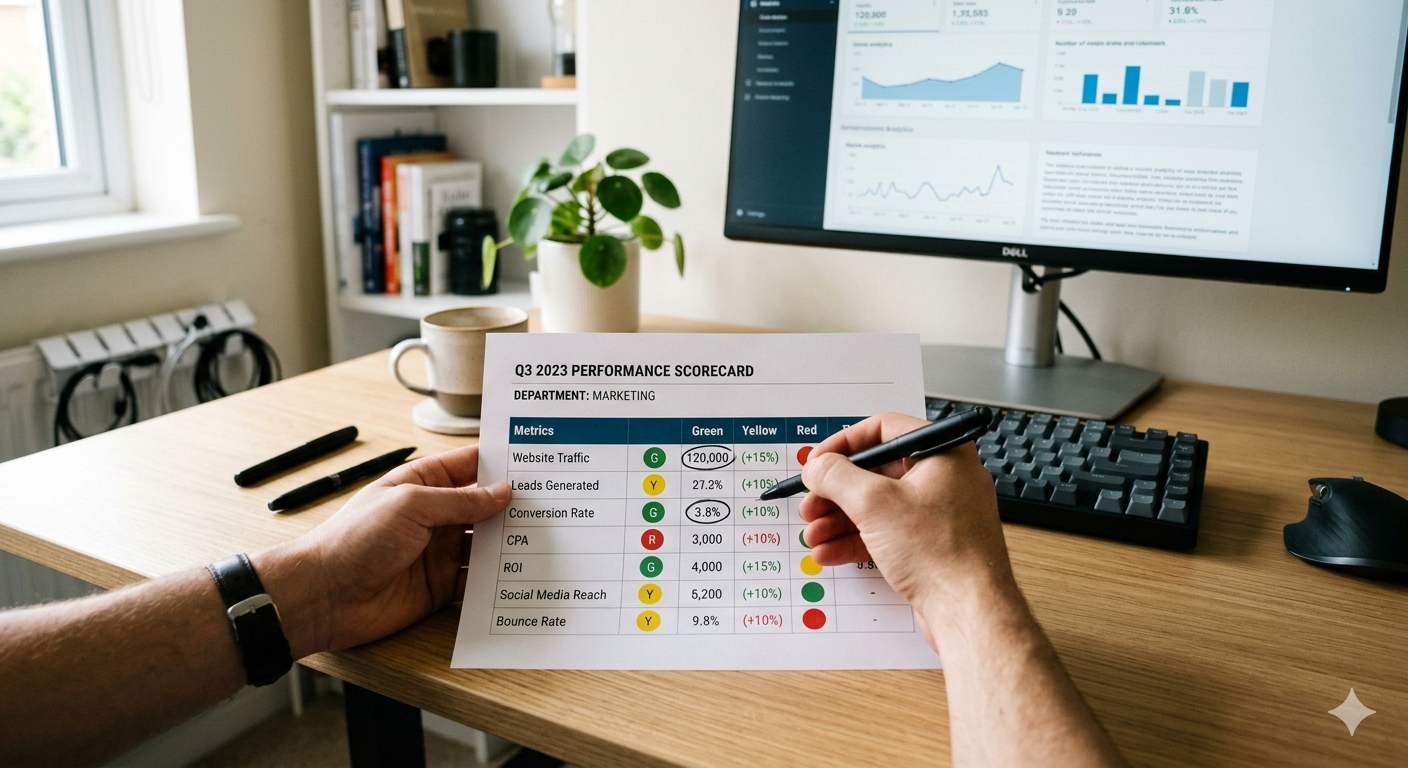
CFO-Ready Reporting: The One-Page KPI Summary
The measurement framework above produces the inputs for a single-page quarterly summary that finance can read in under three minutes.
Connected Product Program: Q[X] Summary
| Category | KPI | This Quarter | Benchmark | Trend |
|---|---|---|---|---|
| Registration | Warranty capture rate | 47% | 40%+ | +3pts |
| Registration | Time-to-register (median) | 6 days | <7 days | Stable |
| Registration | Registration-to-engagement | 34% | 30%+ | +5pts |
| Support | Deflection rate | 38% | 30%+ | +7pts |
| Support | Self-service resolution time | 4.2 min | <5 min | Stable |
| Support | Return-scan rate | 11% | <15% | -2pts |
| Revenue | Aftermarket conversion | 24% | 20%+ | +2pts |
| Revenue | Parts order value vs. retail | +41% | +30% | Stable |
| Revenue | Warranty upsell rate | 12% | 10%+ | Stable |
| Data | Profile completeness | 62% | 60%+ | +4pts |
| Data | Returning visitor rate | 29% | 25%+ | +3pts |
| Data | Data activation rate | 54% | 50%+ | +8pts |
Below the table: three lines of financial translation.
- Support cost saved this quarter: [deflection rate × inbound volume × avg. cost per contact]
- Incremental aftermarket revenue: [registered base × aftermarket conversion rate × avg. order value − retail baseline]
- Program ROI (trailing 12 months): [total value generated ÷ platform and operating cost]
This format answers the question the CFO is actually asking: is this program paying for itself, and is it getting better? If the answer is yes and yes, budget requests are straightforward. For the full business case methodology, see the connected product ROI guide.
From Metrics to Action
Measuring these KPIs is not the objective. Acting on them is.
Each KPI points to a specific intervention:
- Low warranty capture rate → Fix the unboxing registration flow. Reduce field count. Add a scan prompt to the packaging.
- Long time-to-register → Add a reminder trigger at day 3 and day 7 post-purchase. Test a scan-at-unboxing insert.
- Low support deflection → Audit which support topics drive the most inbound volume. Build content for the top 5. Test zero-agent support flows.
- Low aftermarket conversion → Introduce a parts recommendation module in the connected experience at the 90-day mark. Test bundle offers.
- Low data activation rate → This is an organizational problem, not a data problem. The database exists. Build the campaign calendar.
The brands that treat connected product programs as operational infrastructure — not marketing experiments — are the ones that see these metrics compound. Each improvement in registration rate expands the audience for support deflection, aftermarket revenue, and lifecycle marketing. The returns are not linear; they are multiplicative.
FAQ: Connected Product Program KPIs
Should I optimize for registration rate first, or support deflection first?
Registration first. All other KPIs scale from the size of your registered customer base. A 60% registration rate with a 20% deflection rate (affecting 60% of customers) generates more deflection value than a 30% registration rate with a 40% deflection rate (affecting 30% of customers). The base matters more than the rate. Optimize registration to 50%+ first, then improve the engagement KPIs on that expanded base.
How do I know if my benchmarks are realistic for my product category?
Industry benchmarks vary significantly by category. A manufacturer of high-involvement products (premium tools, appliances) typically achieves higher registration and engagement rates than a manufacturer of commodity consumables. Adjust benchmarks based on: (1) product price point, (2) warranty terms, (3) installation/setup requirements, and (4) aftermarket opportunity size. A $50 item will likely show lower absolute numbers than a $500 item. Start with category averages and track your own trend; beating your own trend matters more than hitting an external benchmark.
What's the minimum sample size before I trust a KPI's signal?
Weekly KPIs (support deflection, resolution time) need a minimum of 30 events to be statistically meaningful. Monthly KPIs need 100–200 events depending on variance. If your registration volume is under 100 per month, monthly reporting will be noisy; switch to quarterly or use 90-day rolling averages. Small brands should weight toward process metrics (does the experience work as designed?) rather than volume metrics until the base is large enough.
If I'm struggling on one KPI, what do I fix first?
Prioritize in this order: (1) registration rate, (2) time-to-register, (3) support deflection, (4) aftermarket conversion. Each is a prerequisite for the value of the next. A 15% registration rate is a hard ceiling on everything downstream. Low time-to-register signals a poor unboxing experience that cascades into lower engagement downstream. Fix the foundation metrics first.
BrandedMark provides built-in analytics dashboards tracking all 12 KPIs above, with benchmark overlays updated quarterly from aggregate platform data.