Why Returns Platforms Can't Solve Product Lifecycle
Returns platforms are good at what they do: label generation, carrier routing, exchange flows, refund automation. If you process significant return volume, you should have one.
But if your goal is to reduce the volume of returns, not just the cost of processing them, you are looking at the wrong part of the product lifecycle.
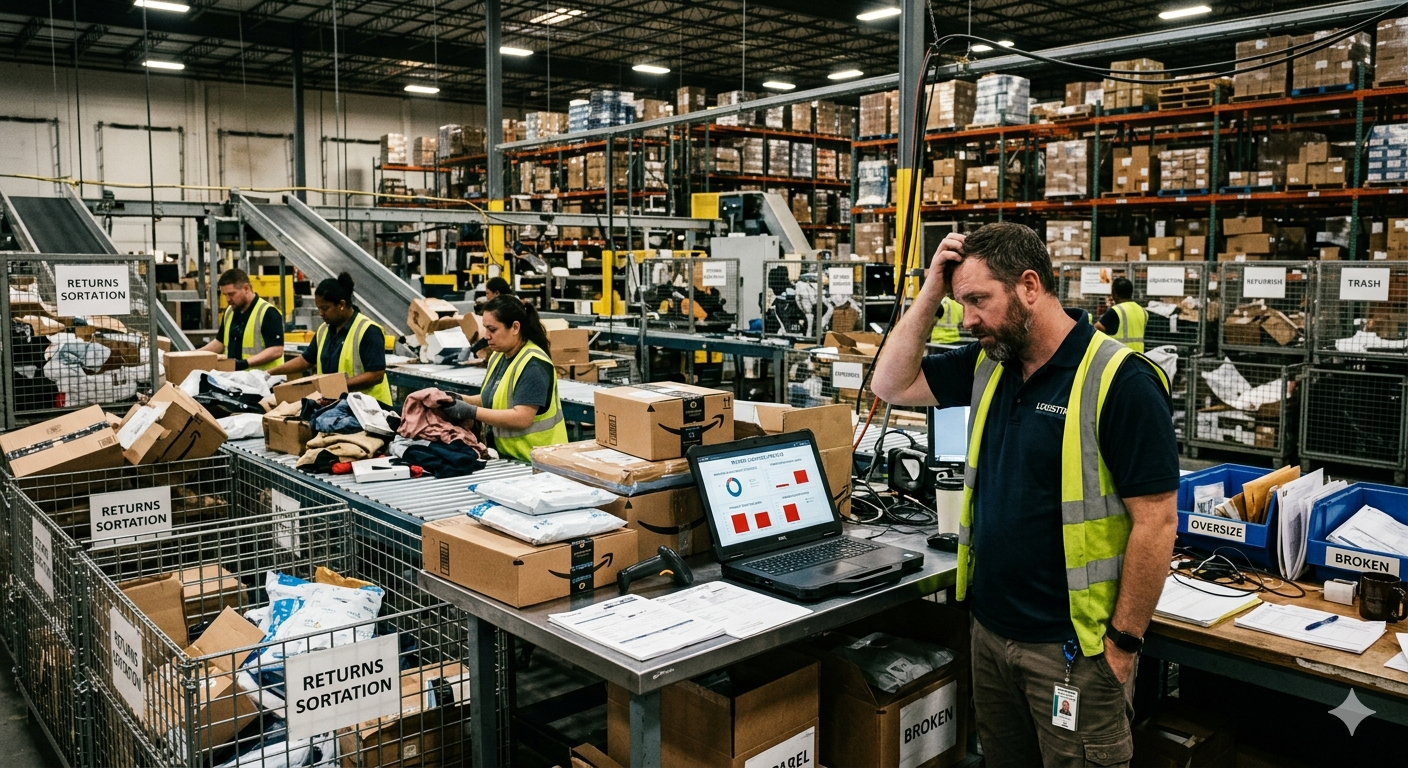
By the time a customer reaches the returns portal, the window to intervene has closed.
The Scope Problem
Review the marketing sites of the leading returns platforms and you will find a consistent pattern. The value propositions centre on speed, exchange conversion, label generation, and carrier cost optimisation.
What you will not find is a claim about reducing the underlying return rate.
That omission reflects an honest acknowledgment of architectural scope. These platforms handle returns better once the customer has decided to initiate one. They were not designed to prevent the decision.
What Returns Platforms Do Well
To be fair about what follows:
- Label generation and carrier routing is genuinely complex at scale
- Exchange and store credit flows convert return intent into retained revenue
- Refund automation eliminates manual processing errors
- Return reason analytics surface patterns by SKU for merchandising teams
These are real capabilities delivering real value. The limitation is not what returns platforms do. It is what they cannot see.
The Lifecycle Events Returns Platforms Miss
A product's ownership lifecycle spans unboxing, setup, active use, support, parts needs, and end of life. Returns platforms operate in a narrow window at the tail end. Everything upstream is dark.
Setup Failure (Days 1-7)
Setup and initial use failure is consistently identified as a leading precursor to returns in consumer electronics, appliances, and connected home devices. Customers who cannot get a product working as expected in the first few days are far more likely to return it than those who succeed at setup. Return reason codes like "product didn't work as expected" and "too complicated to use" often dominate returns data in these categories, yet they describe onboarding failures, not product defects.
The fix is not a better manual. It is in-context guided setup accessed at the moment of unboxing, delivered through the product itself via a scan. When the customer's first interaction with the product includes a setup sequence tailored to their exact model and variant, the gap between purchase and successful use narrows. Returns platforms have no presence at this moment because their architecture begins at the return decision, not at unboxing.
Warranty Registration Gaps
Only 6% of consumers "always" register products (University of Michigan, 2015). The consequence: the manufacturer loses direct customer data and the ability to proactively reach customers with usage guidance.
There is a subtler consequence for returns. A customer who completes registration has made a small post-purchase investment in the product relationship. Registration creates a touchpoint for the manufacturer to deliver setup help, tips, and support before frustration becomes a return decision. Returns platforms do not touch warranty registration. It is upstream.
Support Contacts as Pre-Return Signals
A significant portion of support contacts are pre-return distress signals. The customer is not yet in the returns portal; they are asking one more question before they give up.
US manufacturers paid 1.329% of product revenue on warranty claims in 2024 (Warranty Week). Deflecting these contacts with accurate, self-service troubleshooting, surfaced at the moment of need via a product scan, does not just reduce support cost. It prevents the return that would have followed.
Returns platforms sit after the support flow, not within it.
Spare Parts and Accessories
For durable goods, customer satisfaction in years two and three depends on access to consumables, replacement parts, and accessories. A customer who cannot find a compatible filter or blade often replaces the product, frequently with a competitor.
Connecting customers to parts and accessories at the point of product scan is a retention mechanism, not just a commerce feature. Returns platforms have no role here.
Ownership Transfer
When products change hands through resale, gifting, or transfer, the brand relationship resets to zero. The new owner has no warranty coverage, no setup resources, no support history, and no relationship with the manufacturer. A product with a persistent digital identity that transfers at resale extends the brand relationship to every subsequent owner, each one reachable for parts, service, and eventual replacement purchases. Direct contact matters for safety too: the European Commission recall study shows recall return rates are far higher when owners can be notified directly than when a brand relies on a press release. Returns platforms have no visibility into ownership transfer because it is not a return; it is a lifecycle transition they were not designed to track.
Compliance Infrastructure
The EU Battery Regulation requires battery passports from February 2027. The ESPR introduces Digital Product Passports for expanding product categories. These require persistent, machine-readable product records accessible via a standardised identifier.
Returns platforms are transaction-oriented, not product-record-oriented. A DPP-compliant product identifier is also the mechanism through which every lifecycle event above can be surfaced. It is the product's persistent digital identity.
Upstream vs. Downstream
The brands with the lowest return rates in their categories share a characteristic. It is not better returns portals. It is better onboarding, better self-service support, and better connected product experiences. They intervene before the customer reaches a return decision.
The question for manufacturers is not whether to optimise returns processing. It is whether to also invest in the upstream infrastructure that makes returns less likely:
- Does your product have a digital touchpoint at unboxing? If the first digital interaction post-purchase is the returns portal, you have lost the intervention window.
- Can you trace returns back to setup or onboarding failures? If return reason codes are too blunt to be actionable, you are managing returns in aggregate, not solving them at the source.
- Does your warranty data connect to your returns data? The correlation between unregistered customers and higher return rates is structural. If warranty registration and returns are separate systems with no data link, you are missing a leading indicator of return risk.
- Is your product identifier persistent? A QR code that anchors setup, support, parts, warranty, and compliance from a single scan is fundamentally different from a returns portal URL. See what product trust infrastructure means.
Two Different Choices
A returns platform processes returns efficiently. That is its job. Product identity infrastructure intervenes before the return decision, building relationships that make returns less likely.
These are two different architectural choices. Most brands need both. But if you are investing only in the first and wondering why return rates have not improved, the answer is in the scope.
BrandedMark is the post-purchase operating system for physical products. From unboxing to end of life, every product scan builds the relationship that returns platforms cannot reach. See how it works.